Dashboard Reporting
See Your Entire Business at a Glance.
Track jobs, revenue, team performance and KPIs in one dashboard that updates in real time, without logging into multiple systems.
- No technical setup required.
- Built for trades and services.
- No card required. Cancel anytime.
Real-Time Business Overview
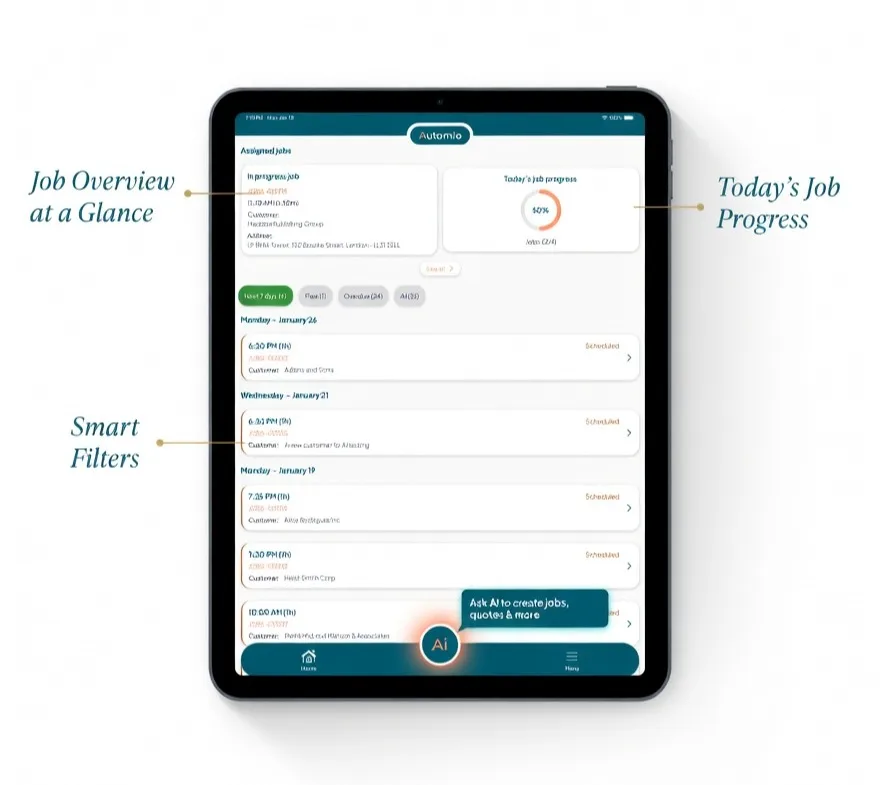
The dashboard gives you a clear visual summary of your operation. See live job counts by stage, today’s scheduled work, revenue this month and team activity without jumping between systems.
Key Performance Metrics
Track jobs completed per day, average job value, first-time fix rate and engineer utilisation. Colour-coded charts make trends easy to spot.
- Filter by date, team or job type
- Customisable widgets
- Live job stage counts
Team and Job Performance
See which engineers are most productive, which job types bring in the most work, and where delays are building up, including jobs at risk.
- Workload balance
- Live schedule and board progress
- Issues before they reach customers
Financial Reporting Made Simple
Monitor invoiced amounts, outstanding payments and job costing from the same view. Accounting integrations help keep the numbers accurate.
- Outstanding payments
- Export or share views
- Easier month-end reviews
Simplify Your Day-to-Day Operations
Customisable widgets let you arrange the information that matters most, whether you work on your own or manage a larger team.
You no longer need to run separate reports or log into several systems just to know what is happening today.
Stay Ahead of Bottlenecks
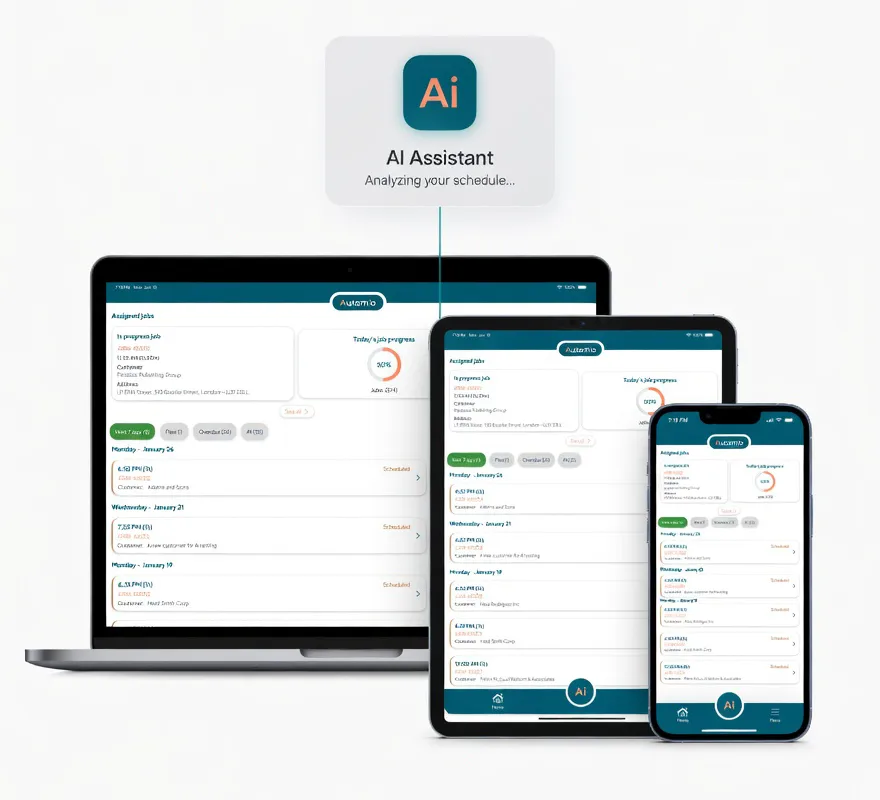
This level of visibility helps you balance workloads, spot problems early and keep jobs moving before they affect customers or cash flow.
Filter the dashboard by date range, team member or job type so you can dig into the detail without leaving the main screen.